
Cinema
Movies, film, and the business of cinema
-
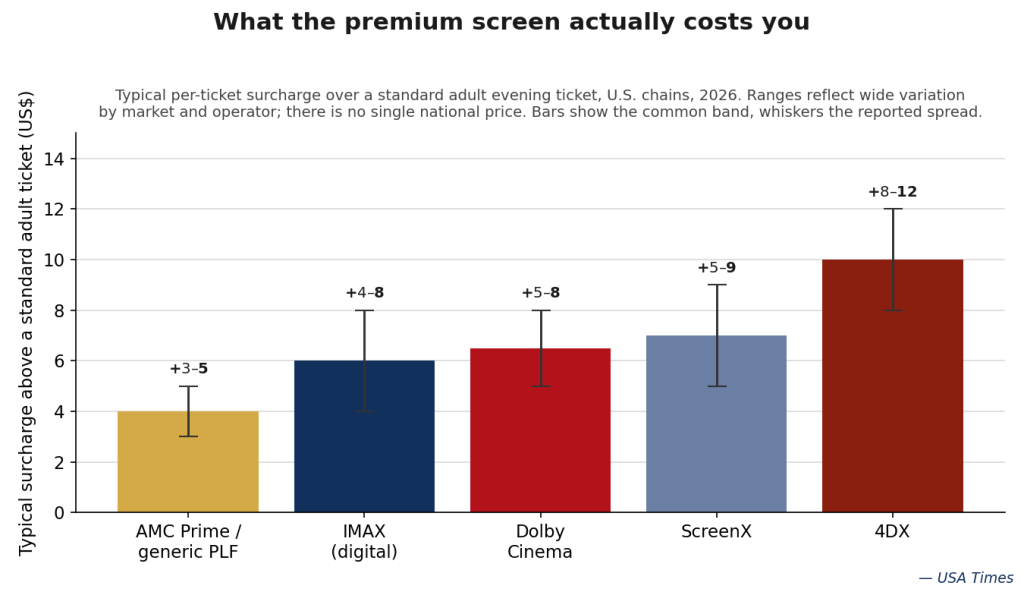
The Premium-Format Surcharge: What You Actually Pay Above a Standard Movie Ticket in 2026
IMAX, Dolby Cinema, ScreenX and 4DX all charge extra, but not the same extra, and not the same everywhere. We break down the 2026 U.S. surcharge for each premium format and explain why two theaters can price identical screens $5 apart.
-
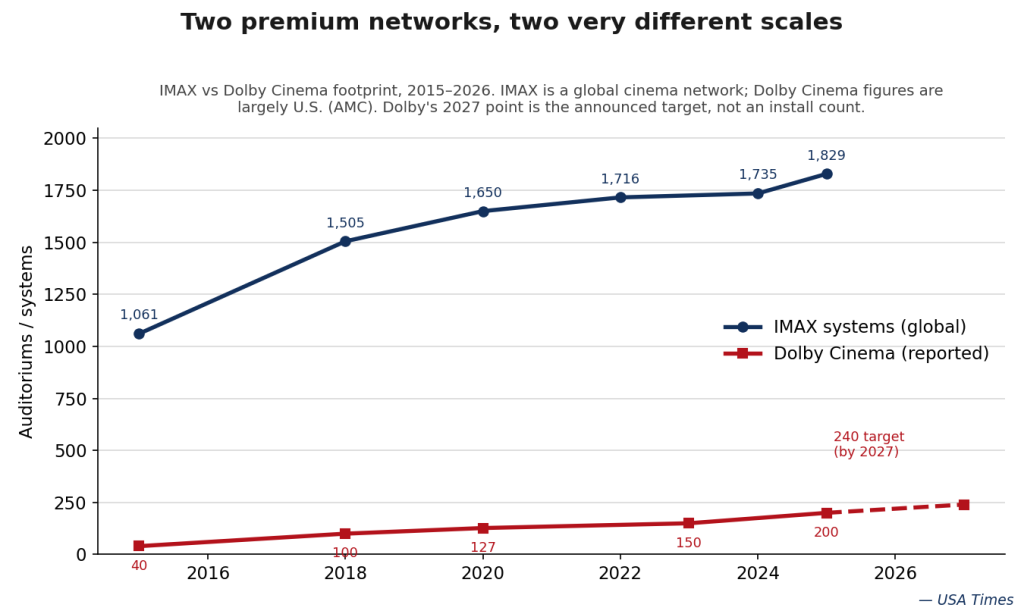
Dolby Cinema vs. IMAX: A Decade of Premium-Screen Network Growth, 2015–2026
IMAX and Dolby Cinema are both called premium networks, but one is roughly nine times the size of the other. We chart a decade of screen counts, 2015 to 2026, and explain why the two rivals grew on completely different curves.
-
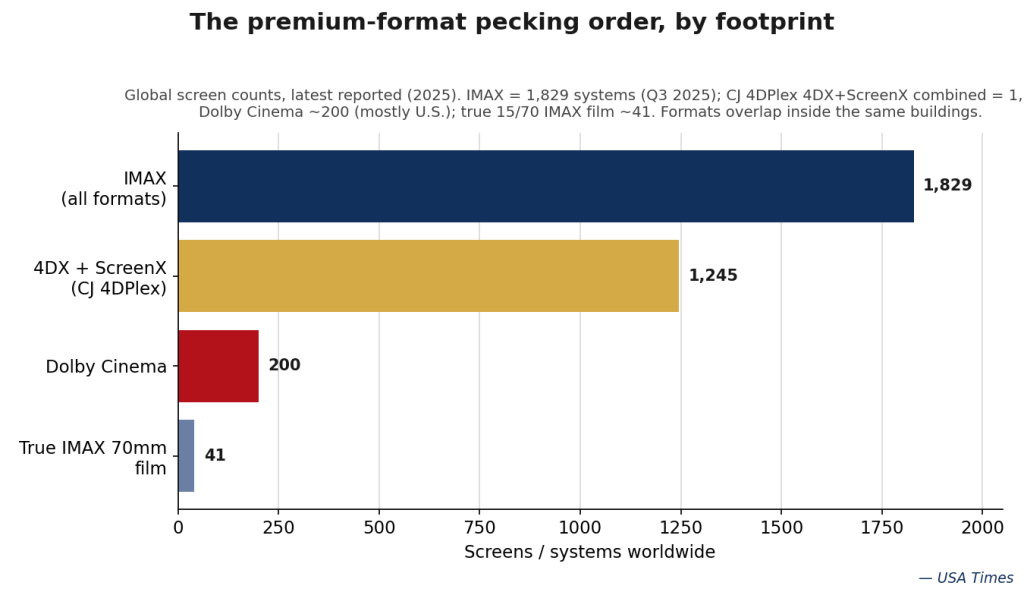
Premium-Format Showdown: IMAX 70mm vs. IMAX Laser vs. Dolby Cinema vs. ScreenX vs. 4DX, by the Numbers
Five premium formats compete for your upcharge, but they are not the same product. We line up IMAX 70mm, IMAX with Laser, Dolby Cinema, ScreenX and 4DX on the numbers that matter: screens, picture, sound and price.
-
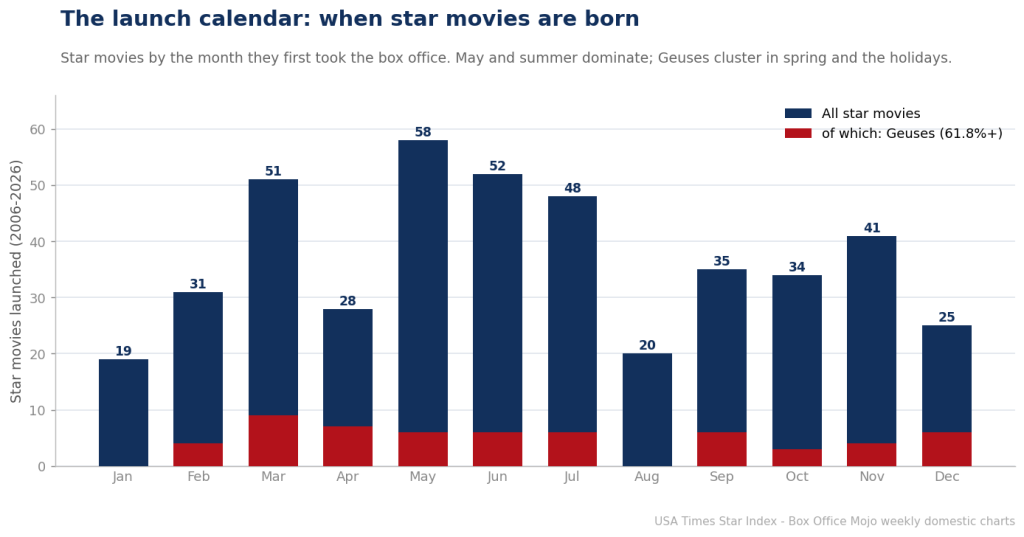
The Launch Calendar: When Star Movies Are Born — and the Two Months That Make None
Star movies aren’t born evenly across the year. May produces the most (58 in 20 years), summer dominates, and Geuses cluster in March and the holidays – while January and August have never produced a single Geuse. A map of when the box office actually makes its stars.
-
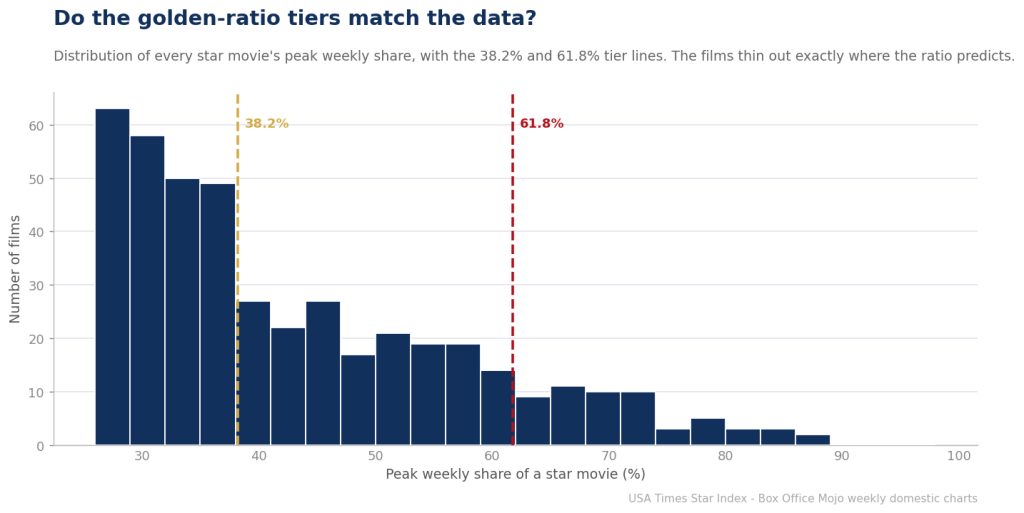
Do the Golden-Ratio Tiers Actually Fit the Box Office? We Checked the Data
The Star Index sorts films into tiers at 26.18%, 38.2%, and 61.8% – powers of the golden ratio. Are those cut points a pretty framework or a real fit? We plotted every star movie’s peak share. The data’s median lands at 38.1%, right on the Betelgeuse line, and thins out exactly where the ratio predicts.
-
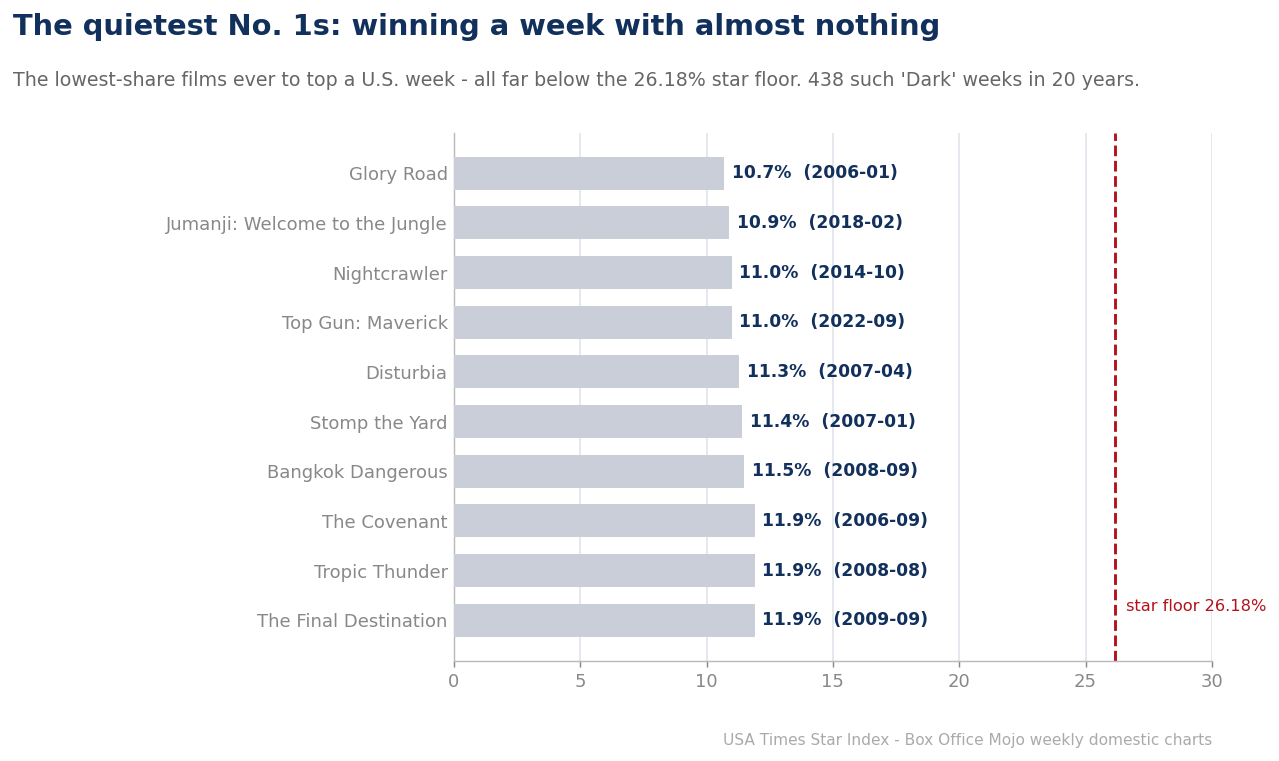
The Quietest No. 1s: The Films That Won a Week With Almost Nothing
On the box office’s deadest weeks, the No. 1 film in America took barely a tenth of the market. The faintest crown on record is Glory Road at 10.7% in January 2006 – one of 438 ‘Dark’ weeks in 20 years where the leader never cleared the star-movie line.
-
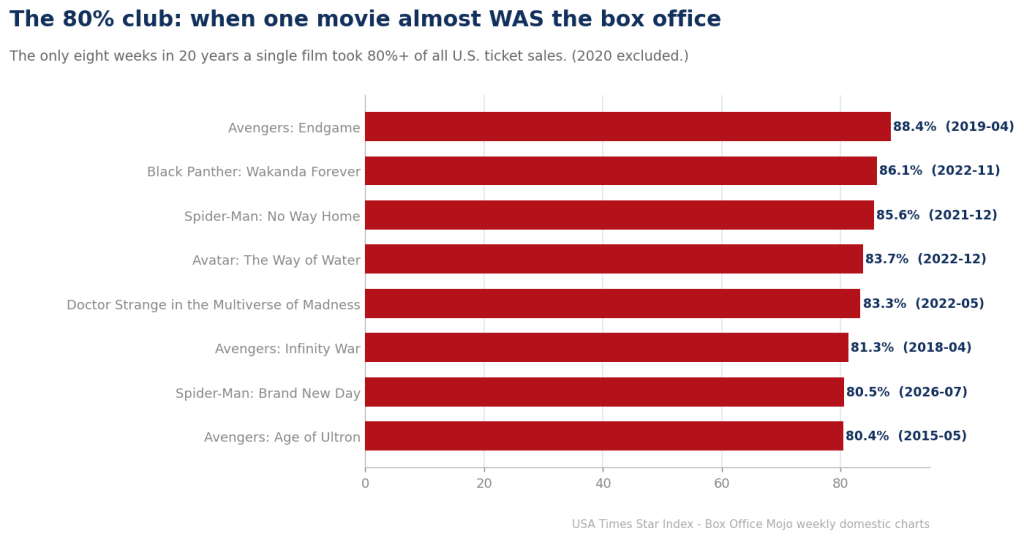
The 80% Club: The Eight Times One Movie Almost Was the Entire Box Office
On eight extraordinary weekends in 20 years, a single film took 80%+ of all U.S. ticket sales – nearly the entire box office. Avengers: Endgame holds the record at 88.4%, and with one Avatar exception, the whole club is Marvel. A look at the market’s rare monopoly moments.
-
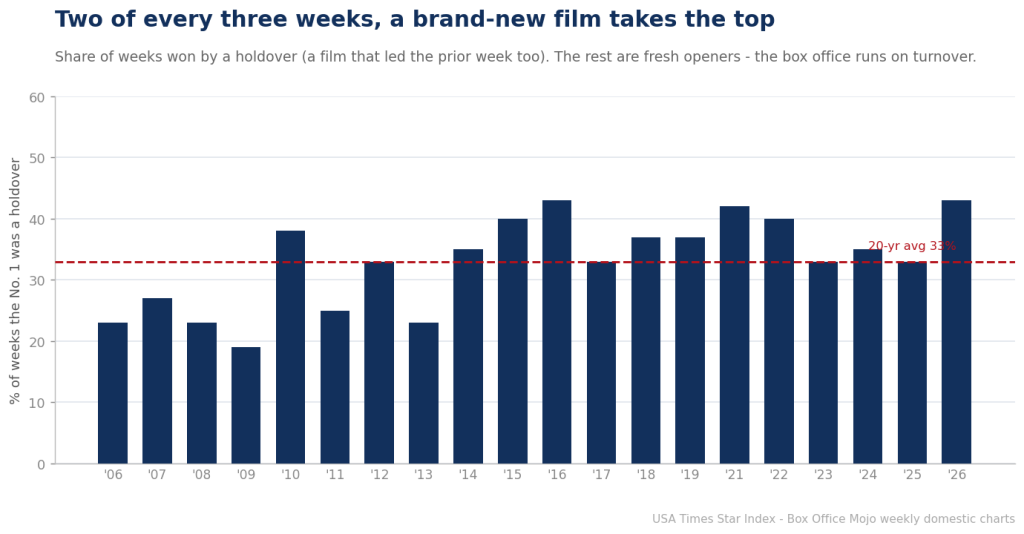
Two of Every Three Weeks, a Brand-New Film Takes the Top: The Box Office Runs on Turnover
The box office runs on replacement. Across 20 years, 67% of weekly No. 1 films were brand-new openers and only 33% were holdovers defending the top. The holdover rate is a hidden competitiveness gauge – and it’s been rising as the market concentrates around fewer, larger films.
-
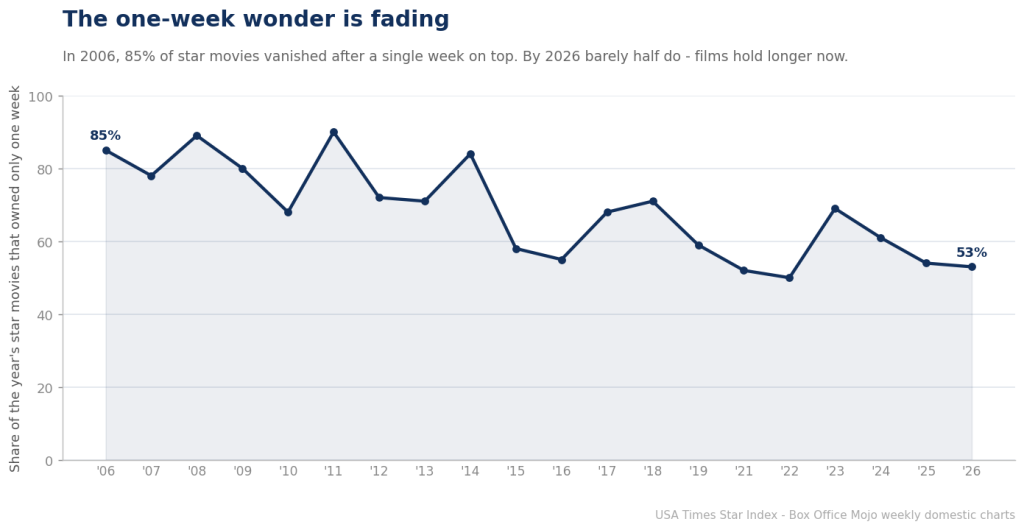
The One-Week Wonder Is Fading: Star Movies Held the Box Office for a Single Week 85% of the Time in 2006 — Now It’s Barely Half
For most of box-office history, owning the top spot meant owning it for exactly one week. Not anymore: 85% of 2006’s star movies were one-week wonders; by 2026 barely half are. Films hold longer now – another symptom of a market consolidating around a shrinking number of giants.
-
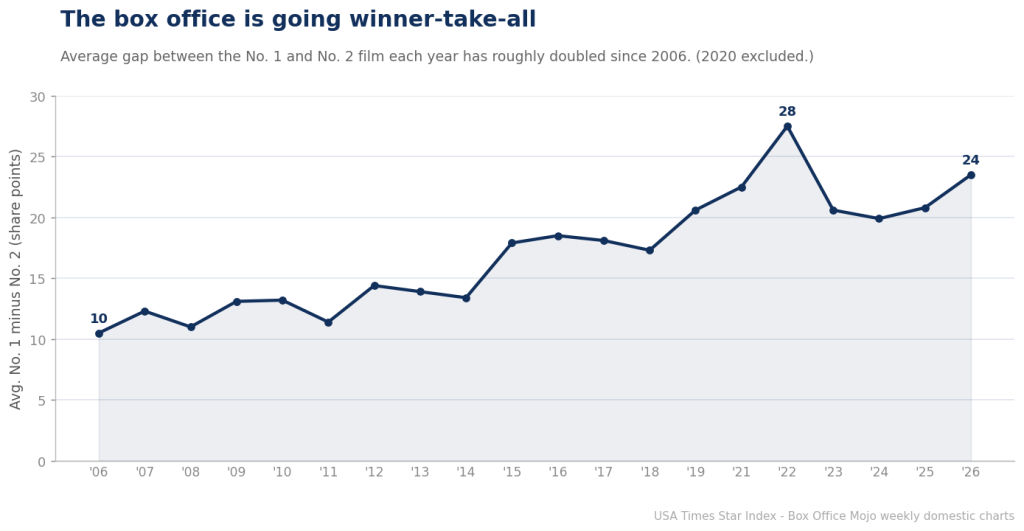
The Box Office Is Going Winner-Take-All: The No. 1–No. 2 Gap Has Doubled Since 2006
The gap between the weekly No. 1 and No. 2 film is a clean measure of how lopsided the box office is – and it has roughly doubled since 2006, from ~10 share points to the low-20s, peaking at 27.5 in 2022. The second-place slot is worth less than it has ever been.